top of page
Why so? Questionnaire and results analysis

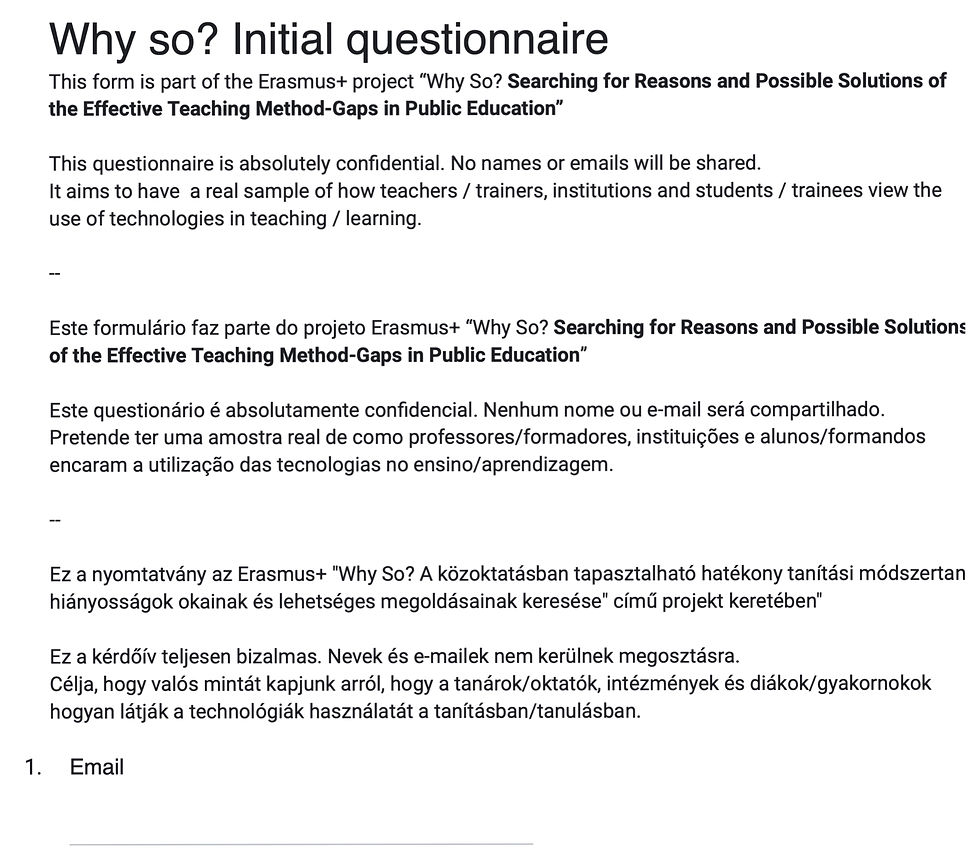
Together with the hungarian colleagues, a questionnaire was carried out and then answered by two hundred people from both countries. After collection, the results were converted in graphs for better understanding. This work was the basis for the elaboration of the SWOT analysis.
Graphical data analysis

Age

Gender

Where do you work

How long is your commute

What nationality are you

How long have you been a teacher-trainer

How motivated were you when you started your career 1 to 5

How motivated are you at the moment 1 to 5

How many hours do you work per day

Which age groups do you usually work with

How free are you to choose your teaching method 1 to 5

Do you use any of the following instruments in your daily working activity

How would you rate the importance of working with technology 1 to 10

How would you rate the quality of the technology in your working place 1 to 10

How often do you use technology in your daily work 1 to 10

Would you recommend the adoption of technology in teaching to your colleagues

How many hours of classes do your students - trainees have per day

What do your students use technology for

Do your students - trainees use technology when learning 1 to 10

Do you feel that your students - trainees are happy when they use technology 1 to 10

How often do you have a new student or trainer in your class 1 to 10

How easy is it to integrate a new student in your classes 1 to 10

How physically active are you 1 to 10

Does your active lifestyle include a planned exercise 1 to 10

How often do you do relaxing exercises before starting your classes 1 to 10

Do you take some time to do a hobby

If you answered _No_ to the previous question, what is the reason for not doing so

How do you relieve your stress

Have you ever experienced a burnout

How close are you to burnout 1 to 10

Is your work visible to the community 1 to 10

How often is your work shown to the community 1 to 10

Which method do you use to show your work to the community

How much do you feel that your work is recognized when it is shown to the community 1 to 1

How much do you feel that showing your work to the community brings you closer to your stu
bottom of page


